#012
The Pivot

Good morning Readers.
Last night saw the delivery of a key US Economic Data:
The Consumer Price Index (CPI).
CPI measures inflation (the increase in the price of goods) Year-on-Year based on a basket of some everyday goods such as energy, food, housing prices and so on.
The reading shows it’s highest in 41 years at 9.1%. For the past few months of CPI releases, higher and higher prints have sent the markets tumbling lower and lower.
The fear is that the FED is going to brutally hike interest rates again and again to destroy demand and crash the economy to make prices go down and fight inflation.
Now, here comes the good stuff.
Yesterday’s print didn’t send the market lower, even though it’s the highest reading since 1981.
Markets dropped a bit and immediately reversed course.
Could we be close to a Pivot? THE Pivot? Let’s dig in:
Trend, Support and Resistance, Moving Averages
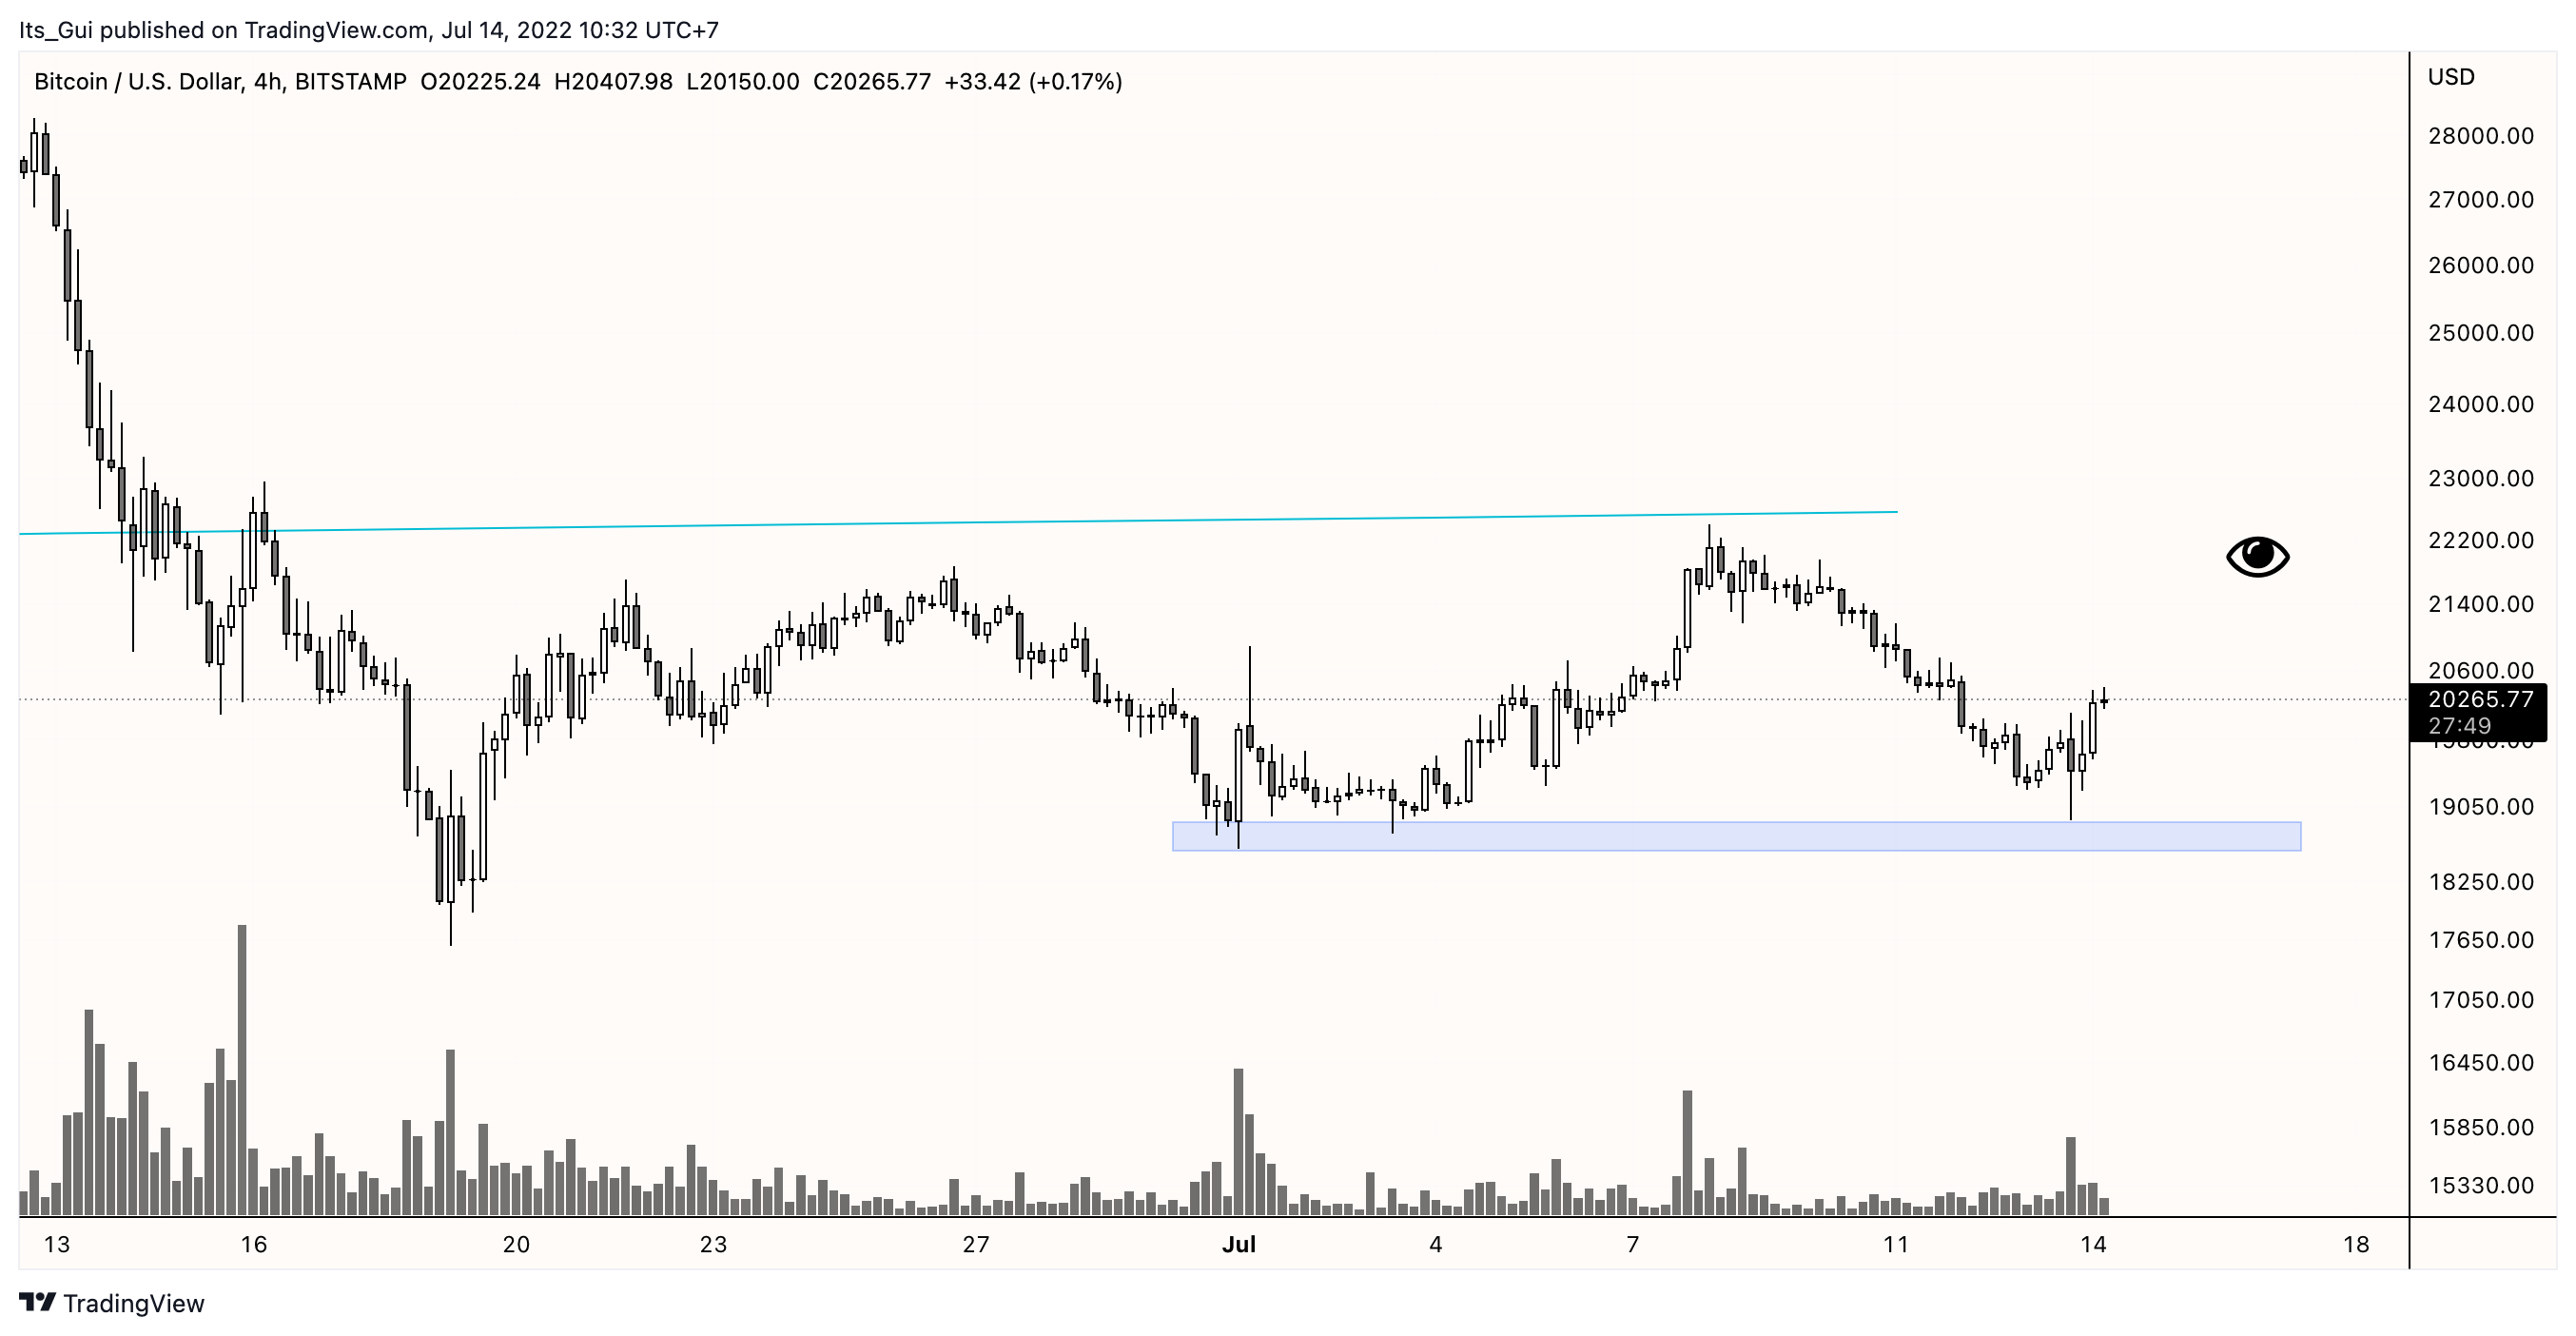
Previous support at $19,000 got tested last night during the CPI release, tagged it and reversed sharply to the upside. A thing of beauty. As long as $19,000 holds, my interest lies in revisiting the higher part of the range. $22,222 is the number.
Up there is the real fight for bulls. Range High + 200 Weeks Moving Average.
A tough one until now.
The fact that the inflation reading didn’t tank the market is a big positive for me. It had the first contrarian reaction in months. This could be a trap, but we’re not here to predict, we’re here to react. It’s Bullish short term until proven otherwise.
A note on the Bond Market
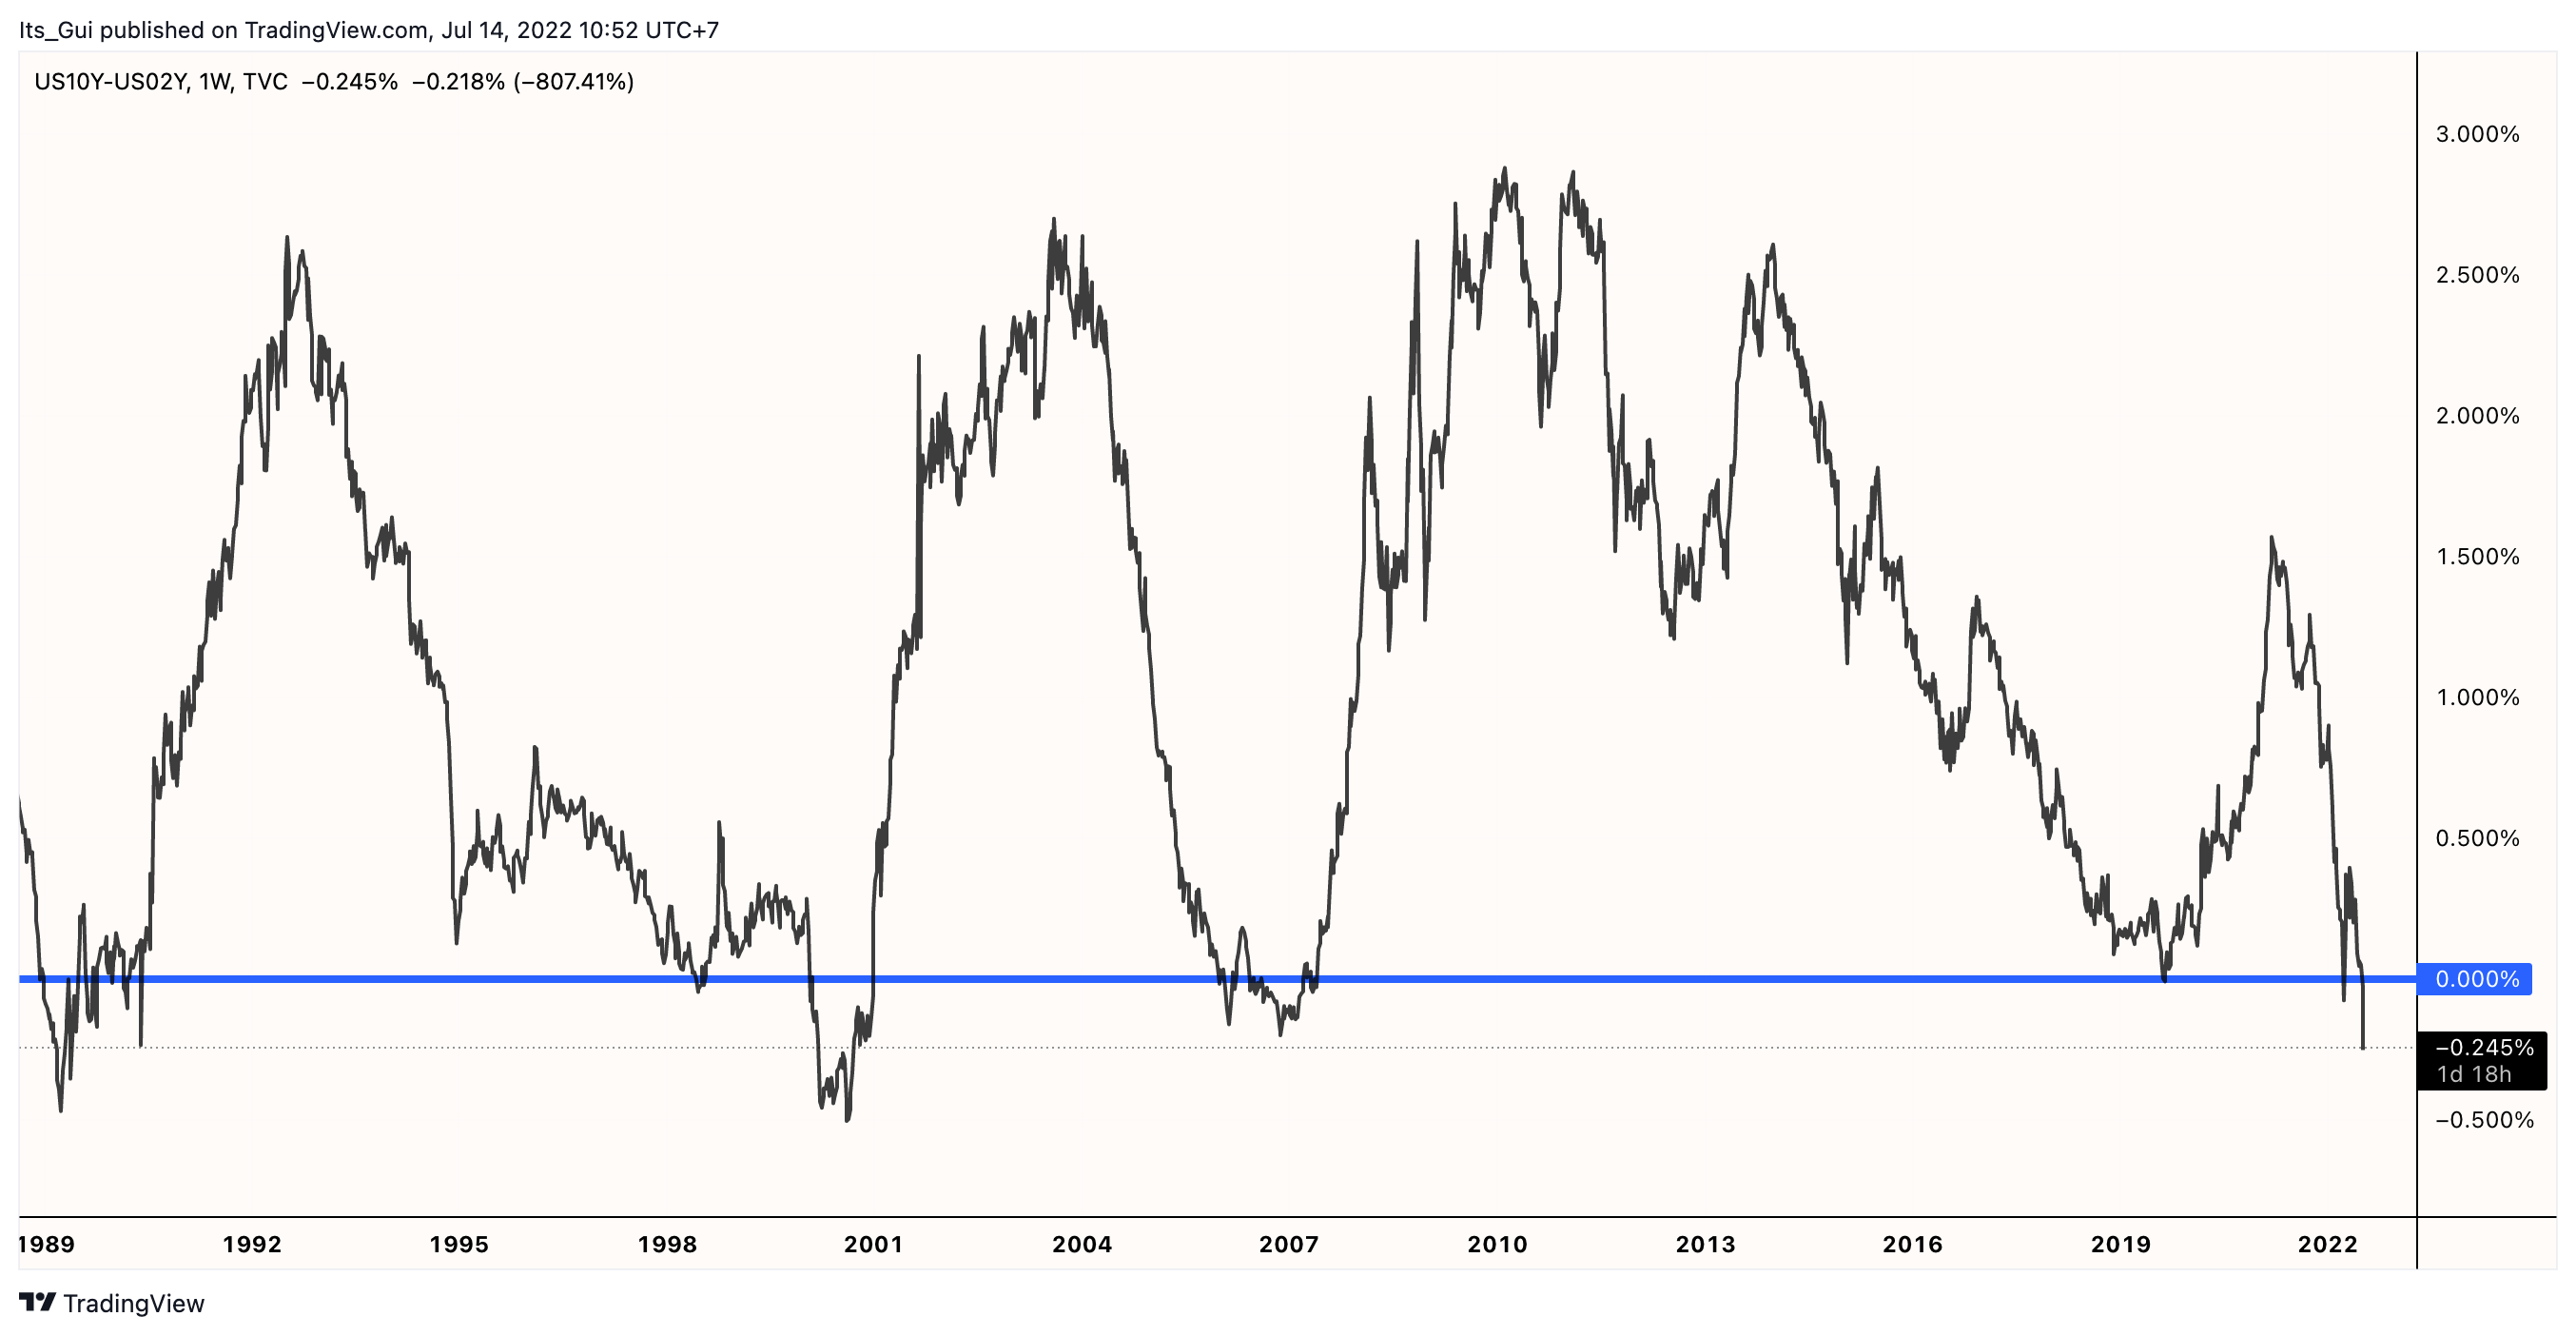
We’re in the Twilight Zone.
The spread between the 10 Year and 2 Year bond is now negative. EVERY TIME there has been a negative reading in the past 55 years, a recession/depression followed in the next 6 to 24 months.
Zoom in on the chart. It’s a weekly timeframe, the years are at the bottom. It doesn’t take rocket science to figure it out: the bond market is a leading recession indicator. Whenever it drops below 0 (the blue line), a recession follows.
An important chart to keep in mind. Even though we’ve bled a lot already, there could be more on the cards.
Will this time be different? One can argue that crashing the economy further isn’t really sustainable and that a multi-year path of soaring inflation, yield curve control and quantitative easing might be a better way. That discussion is for another time.
Bitcoin has never been through a recession or depression. Let’s see if it tanks alongside it or a decoupling happens when people realize that their base currency is once again going to be devalued.
Projections
As Glassnode puts it in their Week 26 Report, “The present market structure has many hallmarks of the later stage of a bear market, where the highest conviction cohorts, the long-term holders and the miners, are under remarkable pressure to surrender.”
With that being said, the Bond Market is flashing recession signals and the FED seems determined to annihilate demand through rate hikes. Until the real pivot comes in - which is another round of quantitative easing - I remain extremely cautious and risk-averse.
My models are still in cash and intend to remain there for another good while, at least until we clear the current accumulation range.
Excellent Content you shouldn’t miss:
This is not financial advice.
Please always do your own research.
Good write up Guillaume, I think a lot of bulls see the 18k - 19k zone as a good buy in area, so no matter the interest rate hike, those areas are still going to be well supported. The next few weeks hold interesting times for the markets, lets wait and see what happens. keep on sharing, thanks.